

Balance Sheet
A Balance Sheet (also called a Statement of Financial Position) is a core financial statement that provides a snapshot of a business’s financial health at a specific point in time. It outlines what your company owns (Assets), what it owes (Liabilities), and the remaining value owned by shareholders (Equity).
While a Profit & Loss (P&L) statement tracks financial performance over a period, the balance sheet measures overall solvency and liquidity. For businesses operating on Sage 50, Sage Accounting, or Sage 200, static month-end balance sheet exports often obscure key working capital trends until it’s too late to adjust strategy.
The Fundamental Balance Sheet Equation
Every balance sheet follows a strict accounting principle: total assets must always equal the sum of liabilities and equity.
-
1. Assets (What You Own)
Assets are resources controlled by the company that bring future economic value.
-
Current Assets:
Cash or items convertible to cash within 12 months (e.g., cash in bank, Accounts Receivable, stock/inventory).
-
Non-Current Assets:
Long-term investments and physical property expected to yield value over years (e.g., machinery, vehicles, intellectual property).
-
2. Liabilities (What You Owe)
Liabilities represent financial obligations owed to external parties.
-
Current Liabilities:
Debts due within one year (e.g., Accounts Payable, short-term loans, accrued expenses, VAT obligations).
-
Non-Current Liabilities:
Long-term financial obligations (e.g., commercial mortgages, bank loans due past 12 months).
-
3. Equity (Net Worth)
Equity represents the net residual interest in the business assets after deducting all liabilities. It includes owner investments, retained earnings, and share capital.
Balance Sheet vs. Profit & Loss (P&L)
Understanding how these two essential financial statements differ is critical to running a healthy business:
| Financial Metric | Balance Sheet | Profit & Loss (P&L) |
|---|---|---|
| Core Purpose | Shows net worth and financial position. | Tracks revenue, expenses, and net profit over time. |
| Time Horizon | A single snapshot in time (e.g., as of Dec 31). | A dynamic range of time (e.g., Q1 or Full Year). |
| Key Categories | Assets, Liabilities, Equity. | Revenue, Cost of Sales, Operating Expenses. |
| Primary Goal | Evaluate liquidity, leverage, and working capital. | Measure profitability and operational efficiency. |
| Automated View in Roveel | Balance Sheet & Cash Summary Dashboards. | Interactive P&L & EBITDA Dashboards. |
Key Balance Sheet Ratios (And How to Monitor Them Live)
Static summaries in Excel quickly hide liquidity risks. Finance managers rely on two core health indicators:
-
Current Ratio (Liquidity Check)
Measures your business's ability to cover short-term debts with short-term assets.
A ratio between 1.5 and 2.0 indicates safe liquidity. Falling below 1.0 means your business may struggle to pay short-term bills.
Instead of manual monthly checks, Roveel continuously monitors current assets against current liabilities from your Sage ledger, displaying a live liquidity score instantly.
-
Working Capital
Calculates the operating liquidity available to fund day-to-day business operations.
Roveel merges incoming Accounts Receivable and outgoing Accounts Payable into visual trend lines so you can spot cash compression before it disrupts operations.
Transforming Static Sage Balance Sheets into Live Visuals
Exporting Sage general ledgers into Excel to build monthly financial reports introduces major friction:
-
Stale Snapshots:
Excel sheets only offer historical balance views, masking intra-month cash dips.
-
Complex Ledger Drilling:
Spotting the source of a sudden liability spike requires opening and auditing individual Sage accounts.
-
Siloed Data:
Non-finance directors struggle to interpret raw trial balances without visual formatting.
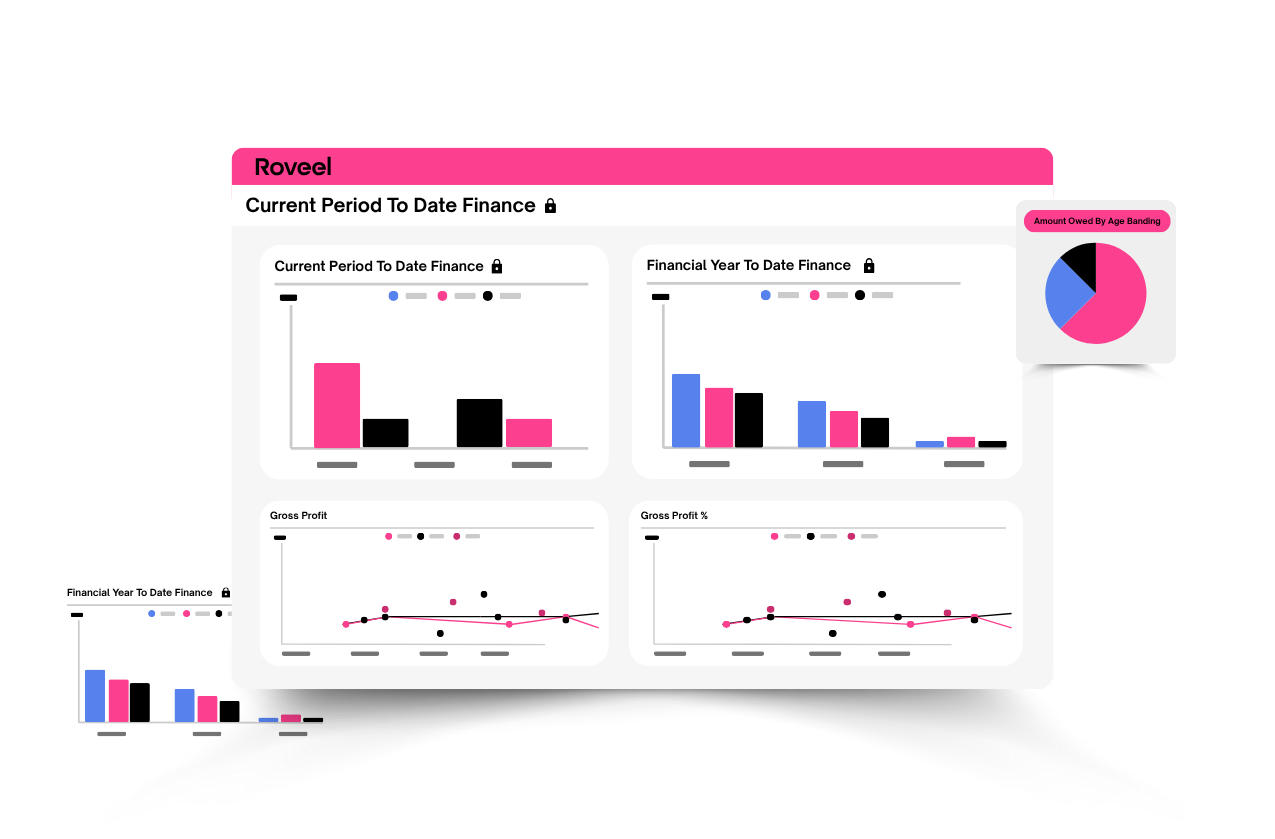
Roveel plugs into your Sage setup in under five minutes, transforming raw accounting code into clear visual dashboards.
FAQs
Why doesn't the Balance Sheet show true business value?
The BS records historical costs, not market value. Intangible assets like brand value or skilled personnel are not reflected in standard accounting balance sheets.
What causes a balance sheet to be out of balance?
A BS becomes unbalanced when a double-entry journal is posted incorrectly, an entry is omitted, or errors occur during manual Excel spreadsheet extraction.
How does Roveel sync balance sheet data from Sage?
Roveel connects directly to Sage Accounting, Sage 50, and Sage 200 using an automated API connector. It updates visual balance sheet (BS) metrics automatically without manual CSV exports.